Welcome to my Portfolio! Hi, I’m Annie. I like puzzles, both in data and in real life, from making dashboards to crafting tiny DIY bracelets. I’m drawn to business analysis in insurance because there’s something exciting about turning uncertainty into insight.
Operational Strategy & People Analytics, Externship
• Analyzed 150+ employee feedback entries using Python (pandas, NLTK) and cluster analysis to uncover attrition risks and segment staff into 5+ cohorts.
• Delivered workforce insights via strategy decks and Excel visuals, reducing analysis time by 30% and enabling targeted retention strategies.
Mar 2025 – Jun 2025
Beats by Dr. Dre
Data Analyst, Externship
• Analyzed 500+ survey responses to identify high-engagement segments and presented insights to leadership.
• Used Python and Tableau to uncover trends from 1,000+ data points, suggesting actions to boost retention by 30%.
Jun 2024 – Aug 2024
BKLYTICS (FinTech Credit Scoring Company with 15+ banking customers)
Business Analyst, Internship
• Analyzed financial data from 4 institutions using SQL and Excel, improving assessment accuracy by 25%.
• Built Tableau dashboards and automated reports from 5,000+ data points to highlight 10% YoY growth insights.
My Skills
Technical & Analytical Skills
Excel 90%
PowerBI/Tableau 85%
Python 80%
SQL 80%
Business & Professional Skills
Business Communication 80%
Critical Thinking 85%
Attention to Detail 90%
Collaboration & Teamwork 95%
Projects
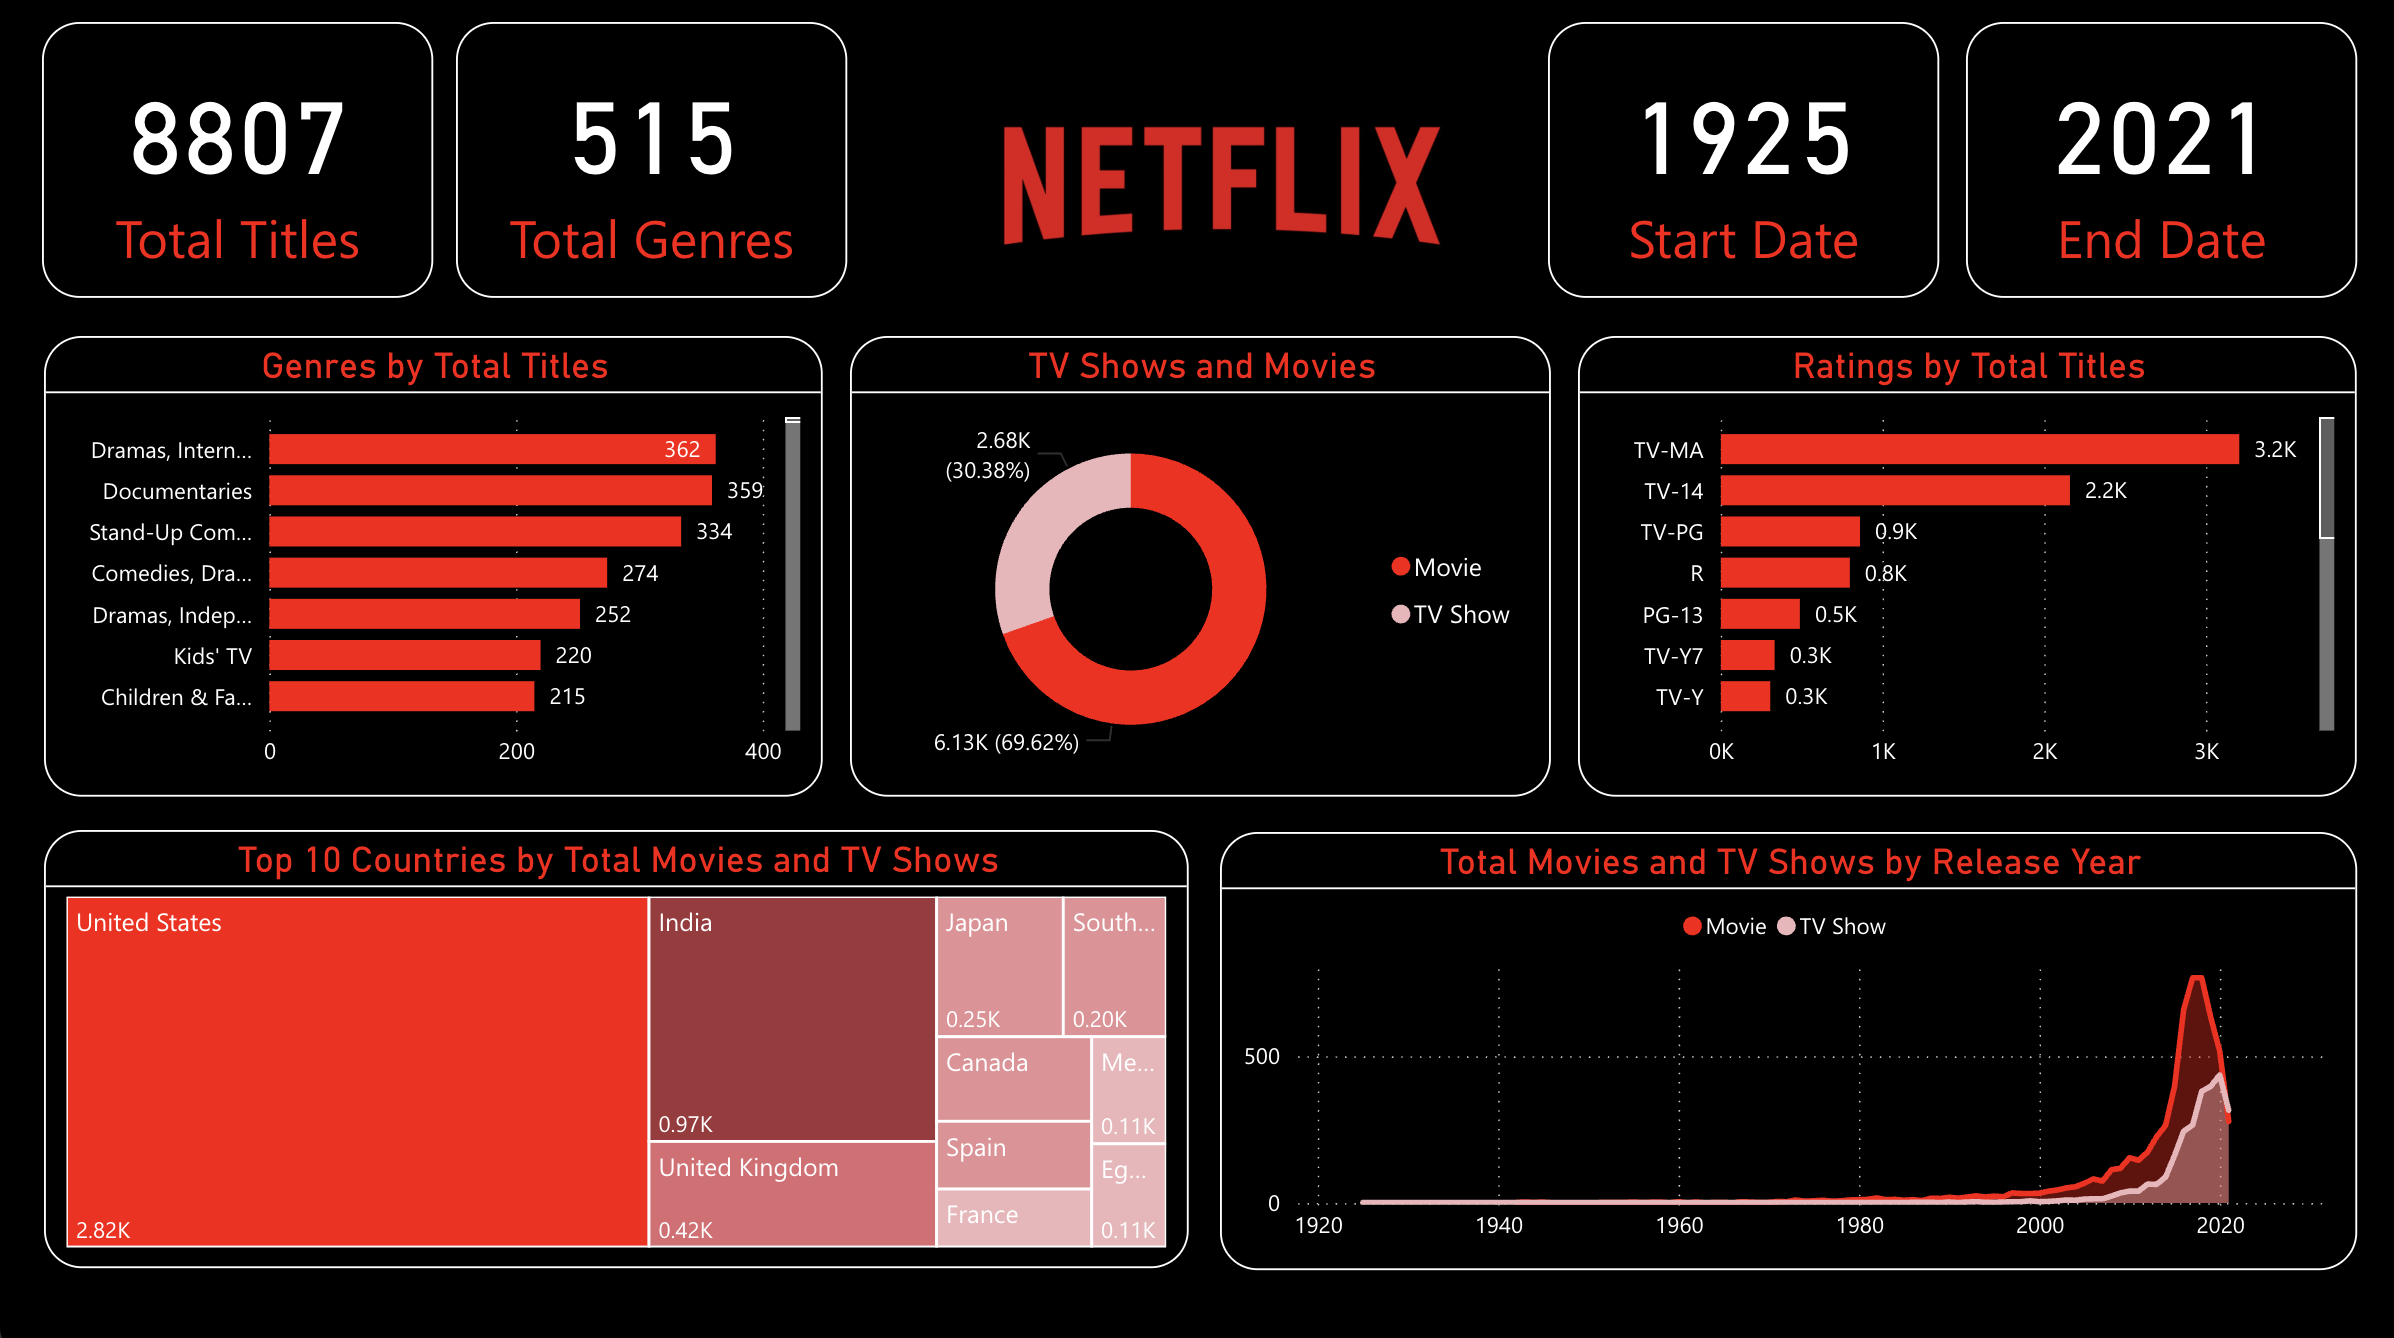
🎬 Netflix Movies and TV Shows Analysis Project
A SQL & Power BI analysis of Netflix content, highlighting genre and rating patterns across countries.
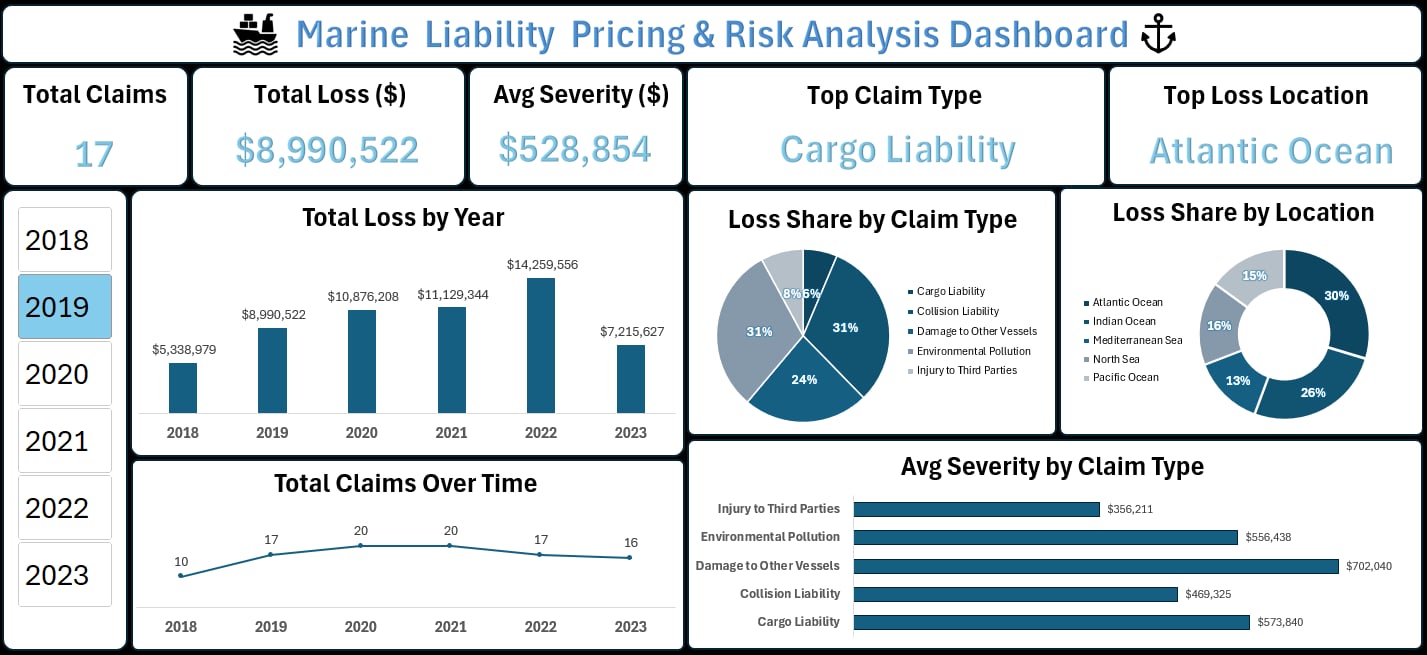
An Excel-based Marine Liability pricing model and dashboard using rating, inflation adjustments, and loss loadings for competitive, sustainable premiums.
Tools: SQL, Power BI Data: 8,800+ Netflix content records
Business Objective
Netflix faces challenges in managing global content diversity and audience preferences. This project explores trends in content type, ratings, genres, and country distribution to guide strategic decisions.
Key Insights
Movies dominate, but TV Shows are rising in recent years
Top content sources: U.S., India, and the UK
Popular genres: Comedies and Documentaries
Distinct rating patterns across content types
Flagged sensitive content based on keywords like “kill” or “violence”
Actionable insights were delivered for content strategy, moderation, and audience targeting. The project showcases structured SQL querying and compelling Power BI storytelling.
❌ Close
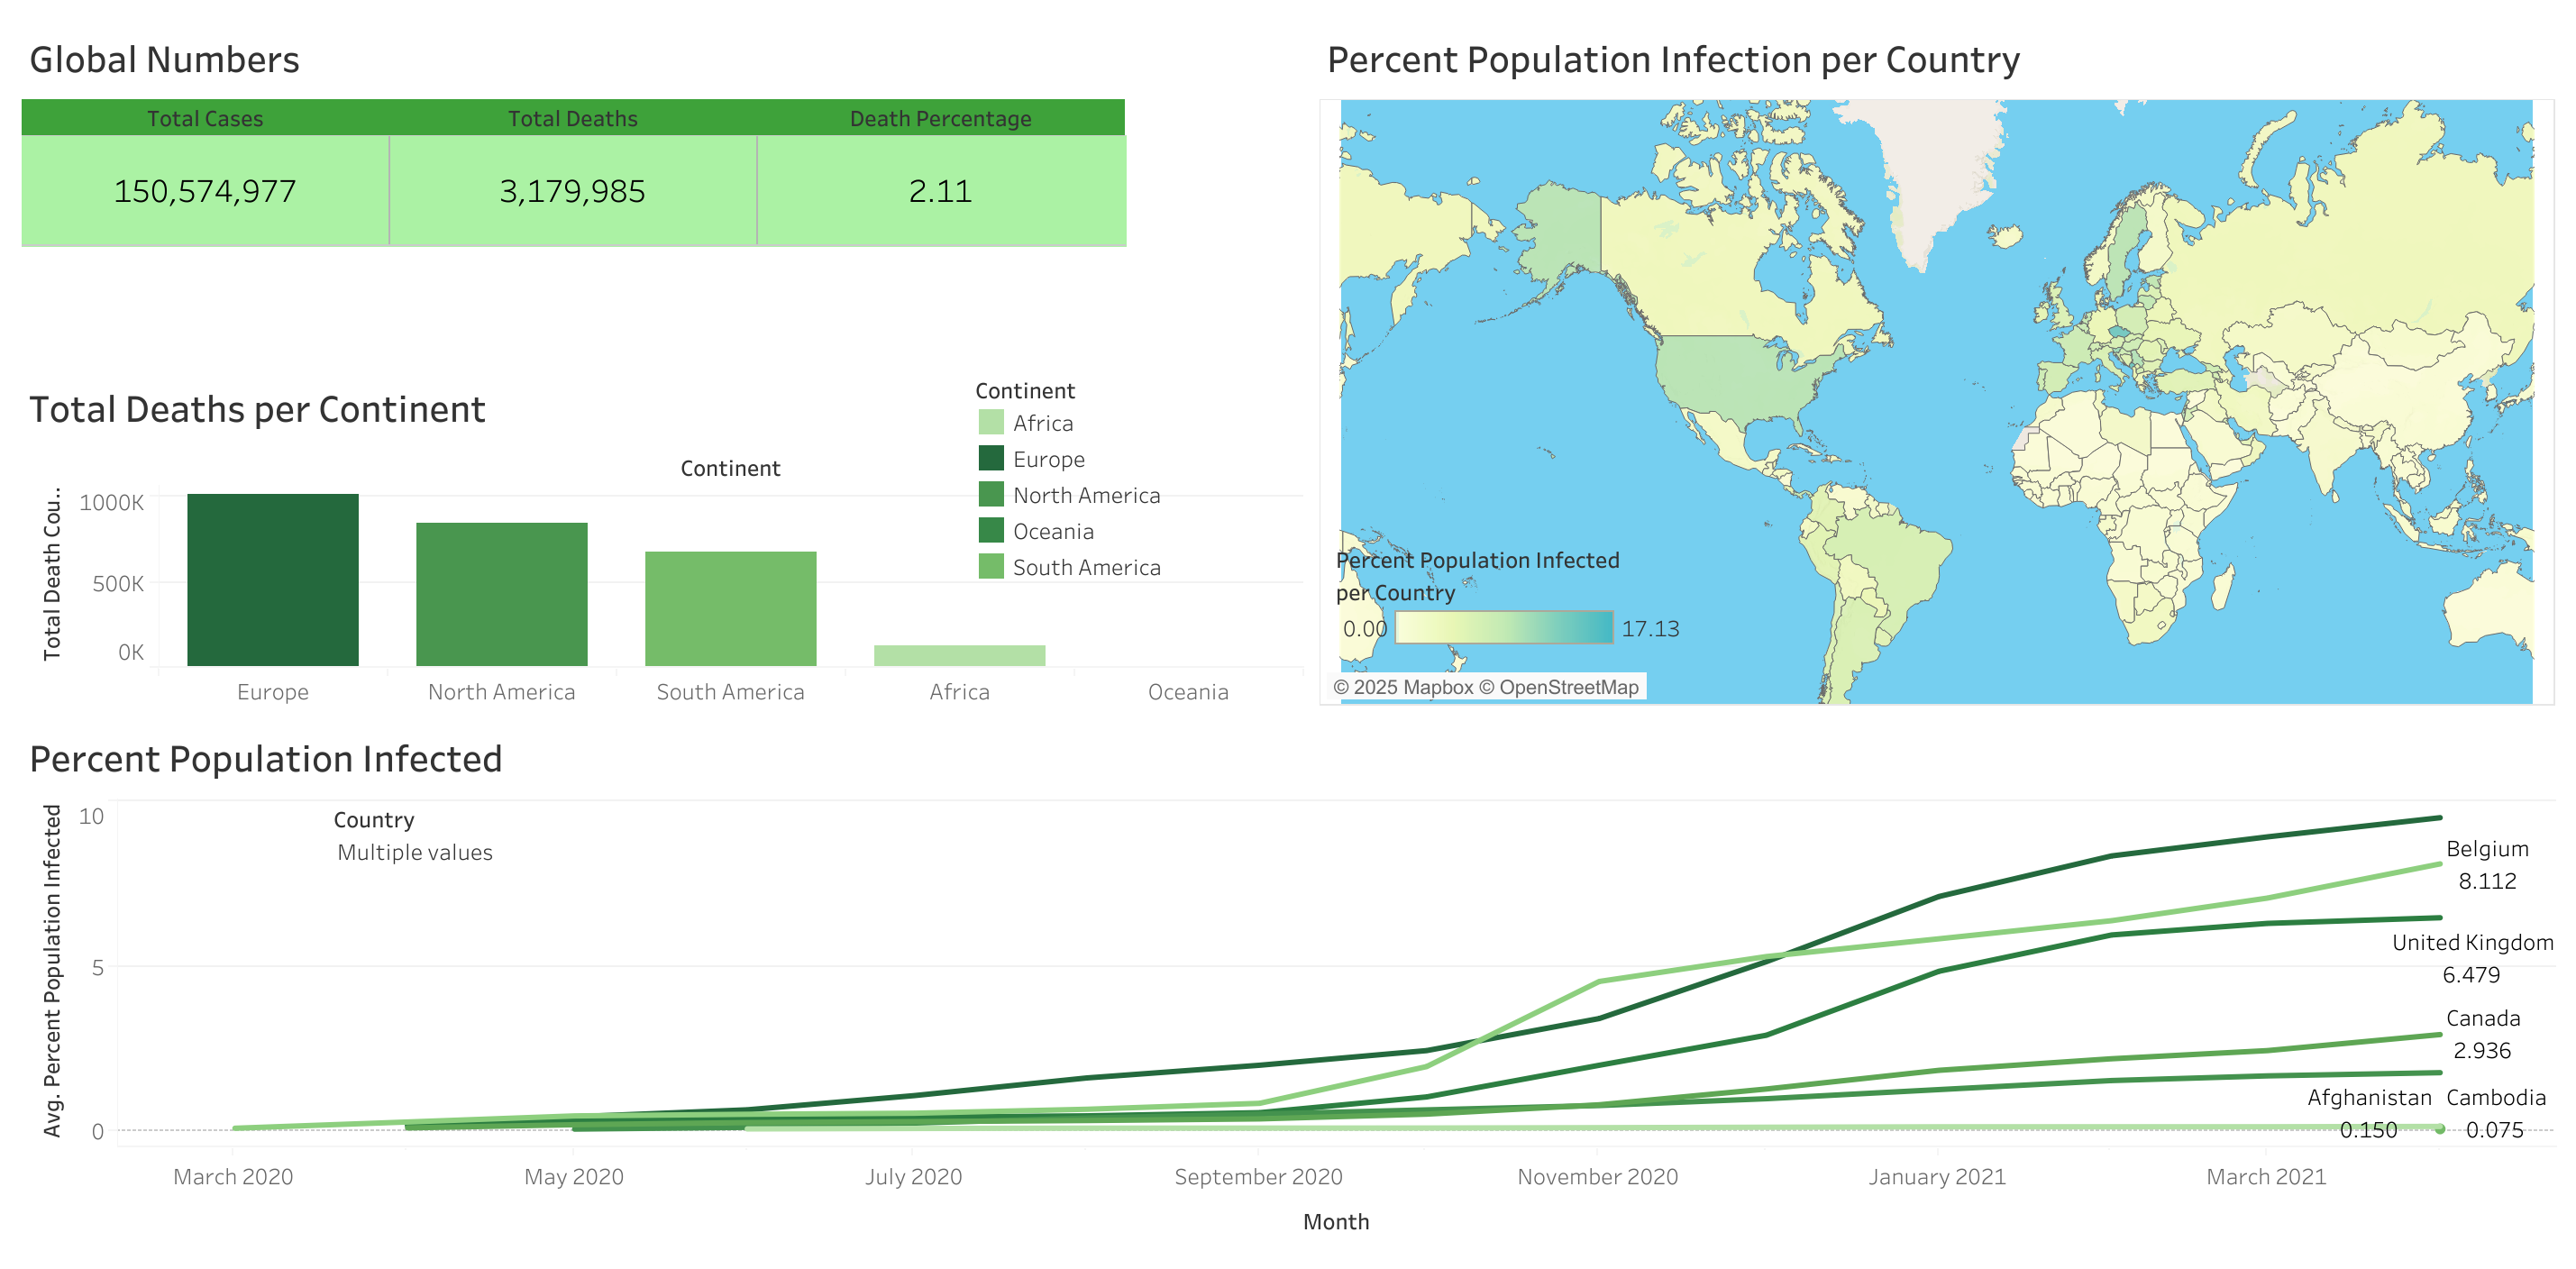
🦠 COVID-19 Global Analysis
Tools: SQL, Tableau Data: COVID-19 cases, deaths, and vaccinations (Our World in Data)
Business Objective
This project explores global COVID-19 trends by analyzing infection rates, death tolls, and vaccination rollouts. It provides public health insights to support policy decisions and identify high-risk regions.
Key Insights
Europe and North America recorded the highest cumulative death counts
Vaccination rollout was uneven across regions
Belgium and the UK had high infection rates per capita
Cambodia and Afghanistan had notably low infection percentages
Rolling totals revealed gaps in vaccination progress
This project helped identify vaccination gaps, high-risk countries, and key pandemic trends. It demonstrates SQL-based data transformation and Tableau visualization skills for public health strategy.
❌ Close
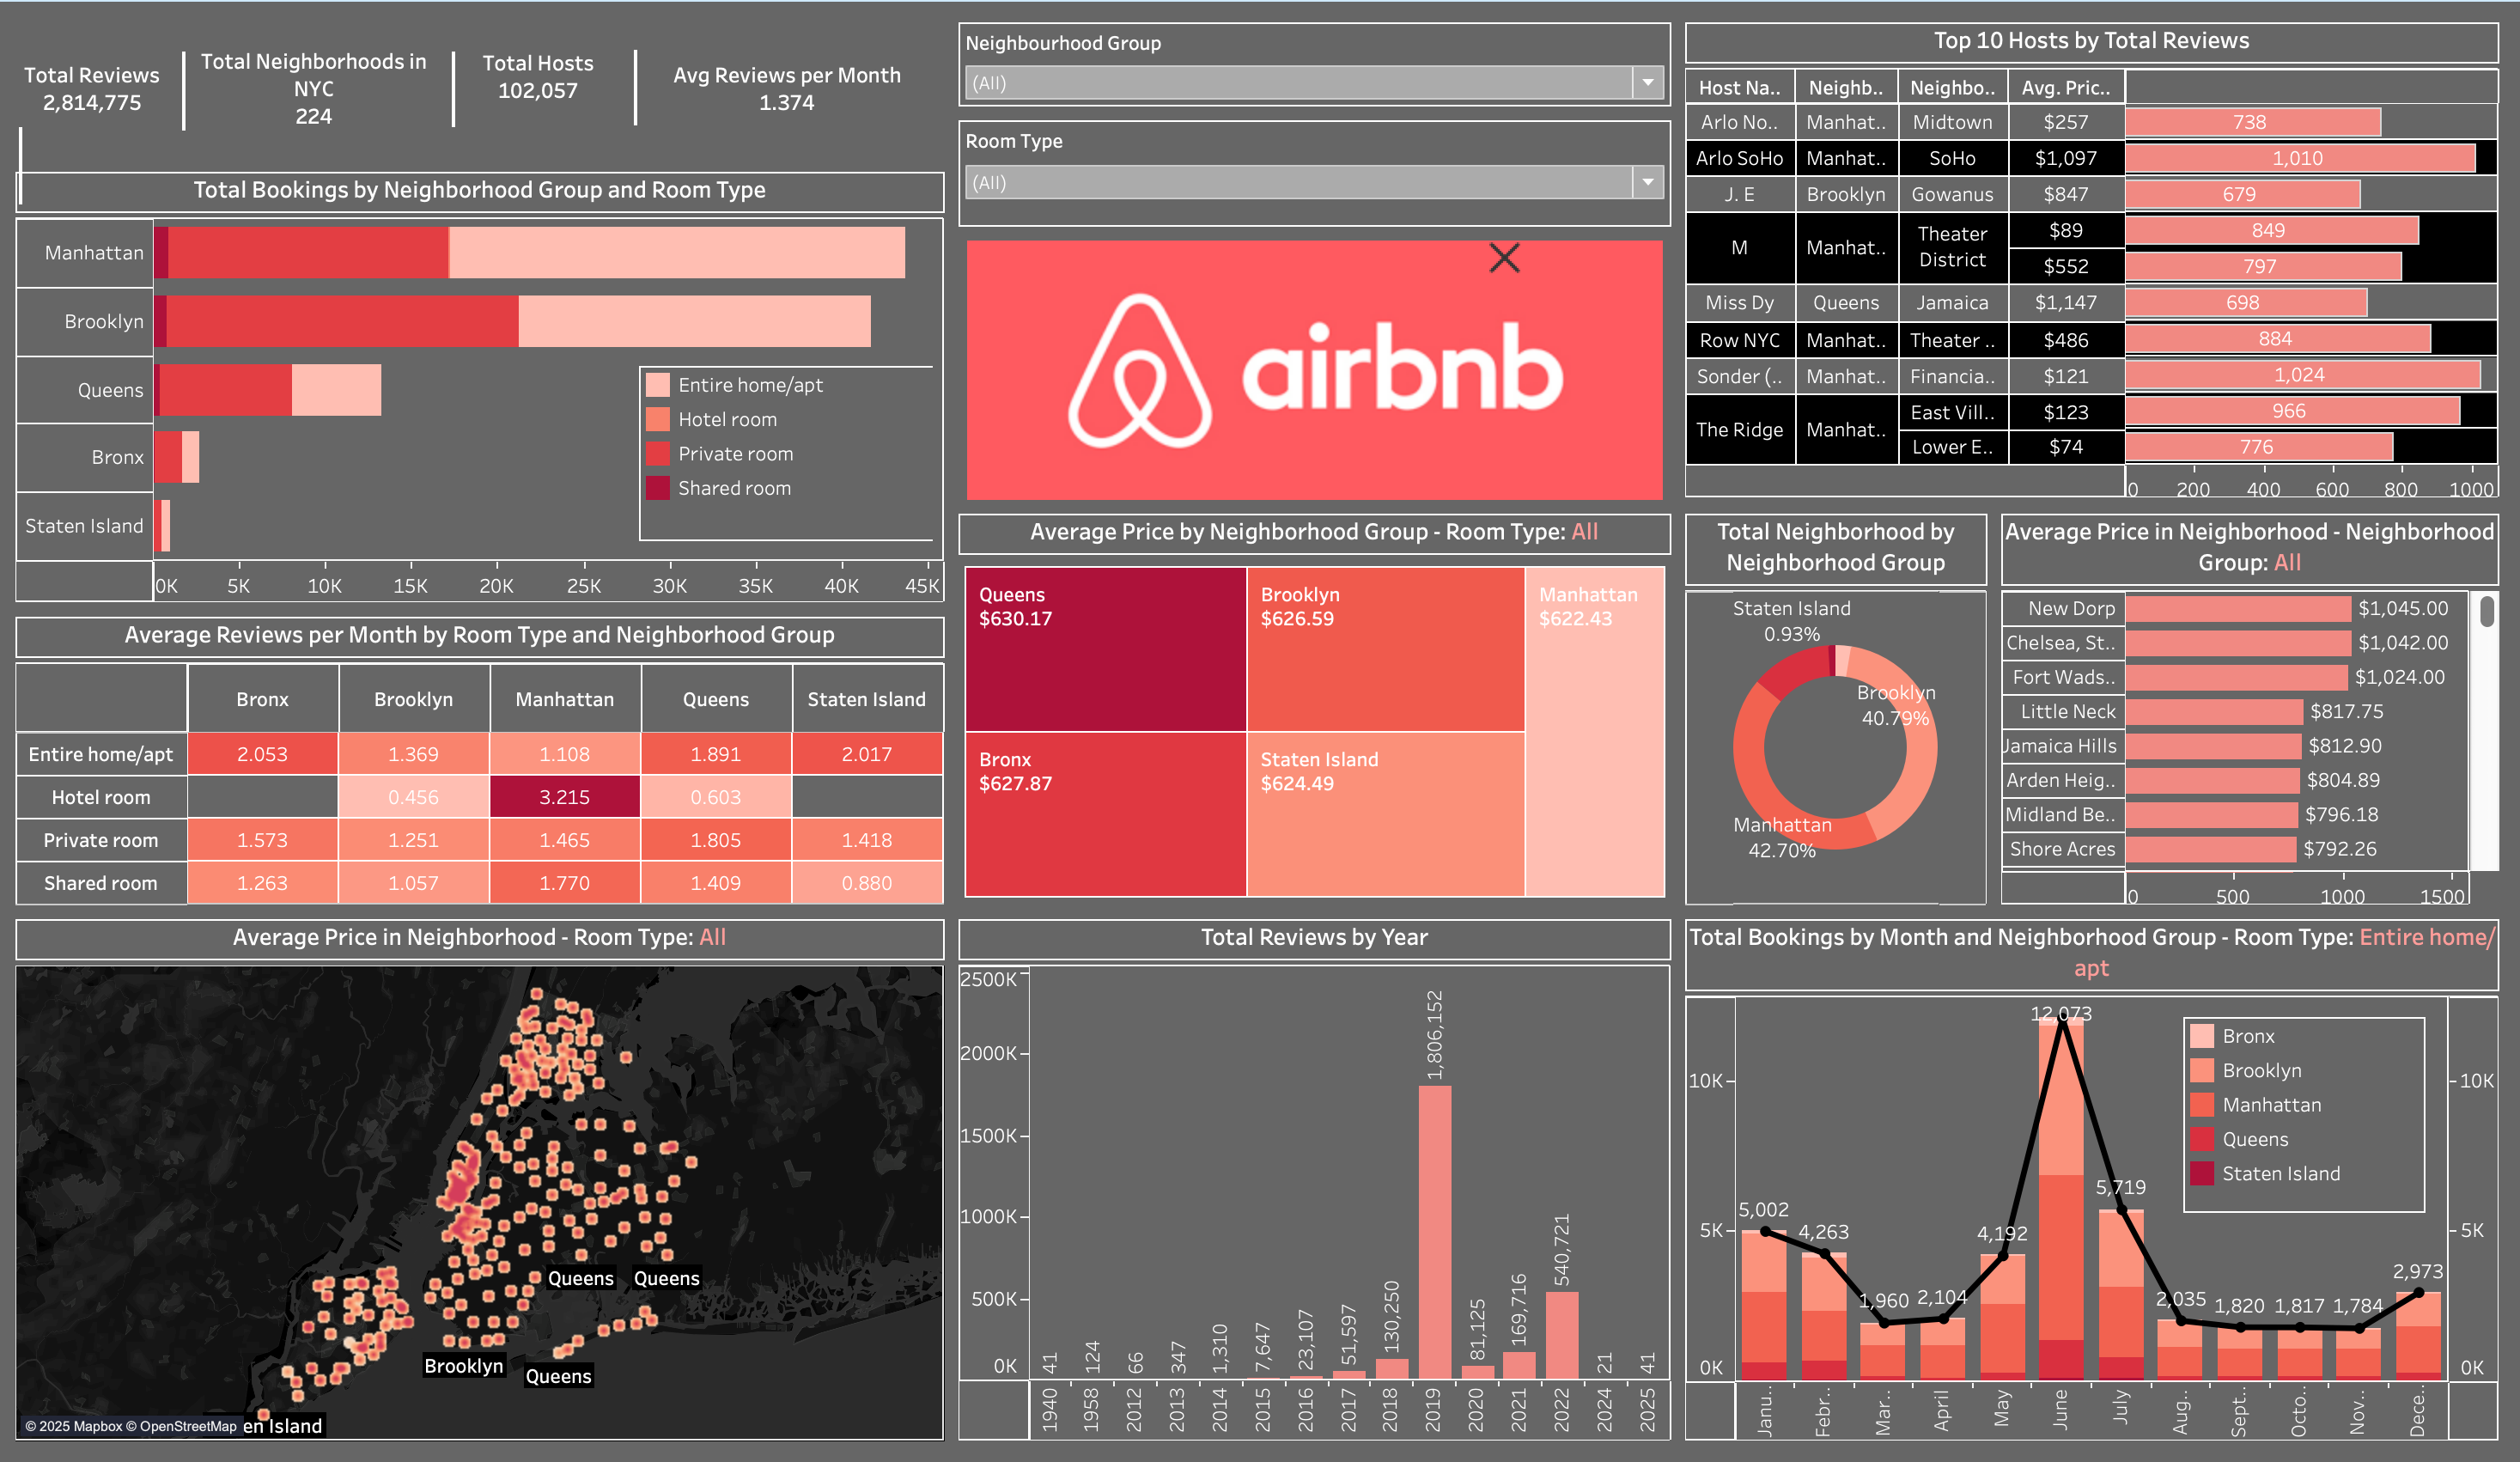
🏠 Airbnb NYC Data Analysis
Tools: Python, Tableau Data: 48,000+ Airbnb listings across NYC boroughs
Business Objective
This project analyzes pricing, room types, and neighborhood availability in NYC Airbnb listings to guide smarter listing and booking strategies.
Key Insights
Entire homes dominate in Manhattan and Brooklyn, with highest average prices
Shared and private rooms cater to budget-conscious users in Queens and Bronx
Review spikes align with summer travel seasons
Some neighborhoods show high availability but low review activity
Room type distribution reveals demand differences by borough
This project highlights actionable insights for both hosts and guests by showcasing data-driven patterns in price, availability, and neighborhood trends. Python and Tableau were used for transformation, analysis, and storytelling.
❌ Close
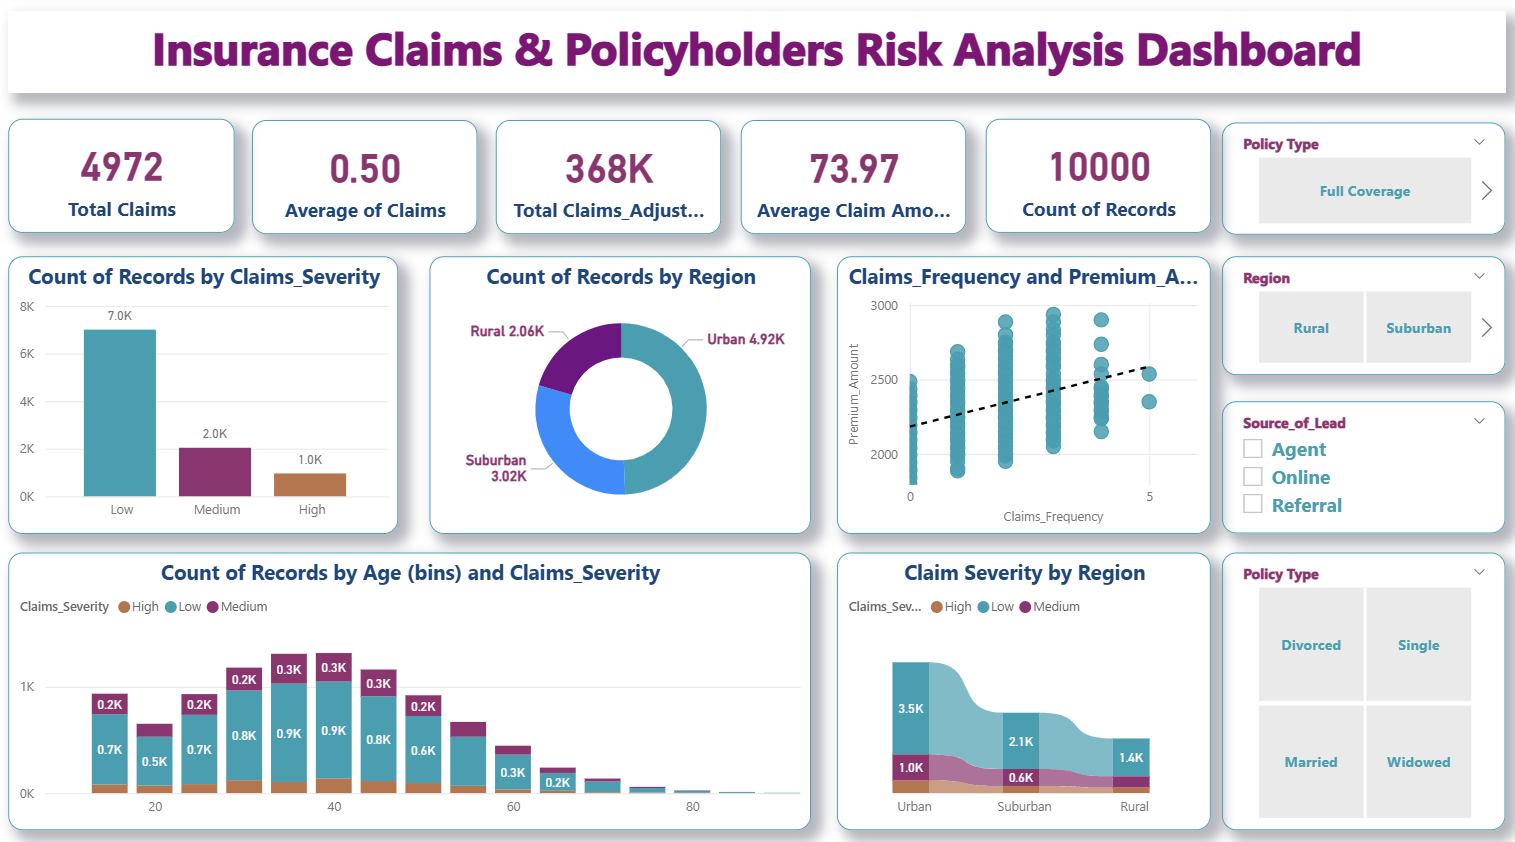
🛡️ Insurance Claims & Risk Analysis
Tools: Python, Power BI Data: 10,000+ insurance policyholder records
Business Objective
This project analyzes claim severity, customer segmentation, and risk indicators to improve pricing strategies and fraud detection in insurance portfolios.
Key Insights
Over 70% of claims were low severity, helping target low-risk segments
Urban areas and younger age groups had higher claim frequency
High-severity claims linked to higher premiums and fewer discounts
Lead source and marital status influenced claim behavior
Feature importance supported fraud detection and risk modeling
Actionable insights were derived to enhance underwriting, pricing, and customer risk profiling. A Random Forest model supported early fraud detection, and Power BI visuals communicated findings to business stakeholders.
❌ Close
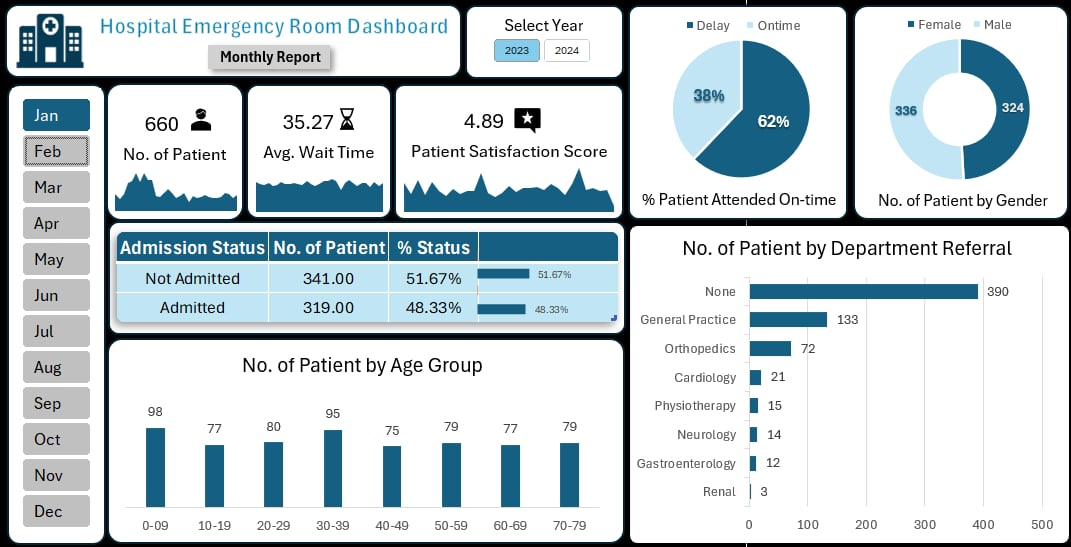
🏥 Hospital Emergency Room Analysis Project
Tools: Excel (Power Query, DAX, PivotTables, Visualisations) Data: 6000+ synthetic ER patient visit records
Business Objective
This project analyzed emergency room performance to reduce wait times, optimize resource allocation, and improve patient care by analyzing referral trends, admission status, and demographic patterns.
Key Insights
80% of patients were seen within 30 minutes, but some departments lagged in responsiveness
Referral counts were concentrated in 3+ high-traffic departments
Male patients and younger age groups were overrepresented in longer wait categories
Daily fluctuations in wait times revealed staffing inefficiencies
Interactive slicers enabled fast drilldowns by date, triage level, and department
This Excel-native dashboard empowered hospital teams to monitor real-time performance, identify bottlenecks, and adjust staffing plans. By leveraging Power Query and DAX, the tool enabled efficient, low-code healthcare analytics with dynamic filtering and clear KPIs.
This project analyzed Marine Liability insurance claims to develop accurate, competitive premiums by assessing claim frequency, severity, and risk distribution, incorporating inflation adjustments and large loss loadings for long-term pricing stability.
Key Insights
Environmental Pollution had the highest severity ($857K avg) and frequent occurrence
Atlantic Ocean was the top loss location, driven by a $5M catastrophic claim
Large loss loading smoothed premium volatility across policy years
Sensitivity analysis showed premiums highly responsive to severity changes
Interactive dashboard enabled quick drilldowns by year, claim type, and location
This Excel-native dashboard enabled underwriters and actuaries to monitor claim patterns, assess risk drivers, and refine pricing strategies. Using formulas, PivotTables, and charts, it delivered efficient, low-code insurance analytics with dynamic filtering and clear KPIs.